As AI technology rapidly advances, AI servers have become indispensable tools for modern data processing. According to a recent Bloomberg report1, the AI industry is projected to reach a market size of $1.3 trillion by 2032. With rising construction costs, many companies are expanding their data centers from urban to suburban areas. The power supply infrastructure in these suburban locations is generally less robust and more prone to outages that can critically impact server operations. To address this, data centers are often equipped with backup power systems, such as uninterruptible power supplies (UPS), solar power systems, and fuel cells, ensuring stable operation even during external power fluctuations.
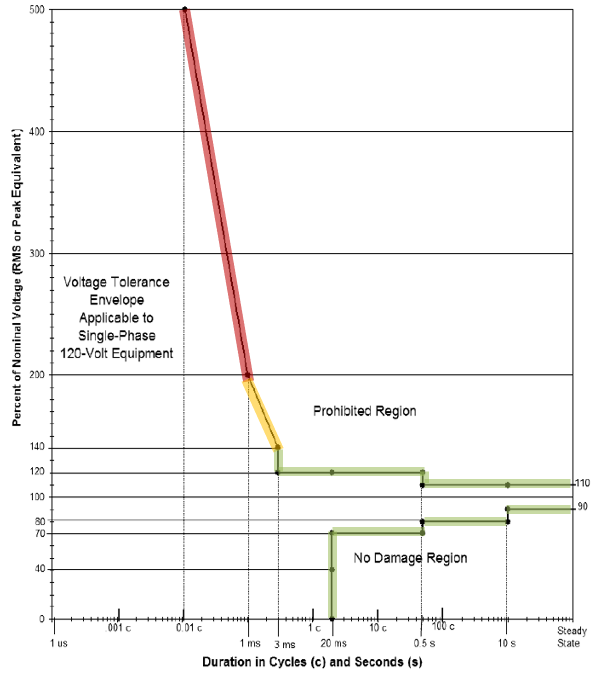
However, as data center stability becomes ever more critical, server power supplies must now demonstrate greater resilience to electrical anomalies. Ensuring uninterrupted operation in unstable power environments has become a top priority for server power supply manufacturers. In 2000, the Information Technology Industry Council (ITIC, formerly CBEMA) published the updated ITIC Curve (Figure 1)2, which defines the tolerance of IT equipment to voltage anomalies, including steady-state and transient conditions. Traditionally, this standard has been widely used for testing IT equipment and is now increasingly adopted by server power supply manufacturers to validate performance under unstable power conditions.

▲Figure 1
ITIC Curve testing includes scenarios with varying voltage levels and durations. For instance, when AC voltage suddenly rises to 140%, it must be sustained for 3 milliseconds; when voltage drops to 70%, it must be sustained for 20 milliseconds. These tests simulate various real-world scenarios, including brief power outages, undervoltage, and even extreme events like 500% voltage surges. The ITIC curve has thus become an important tool for validating server power supply stability.
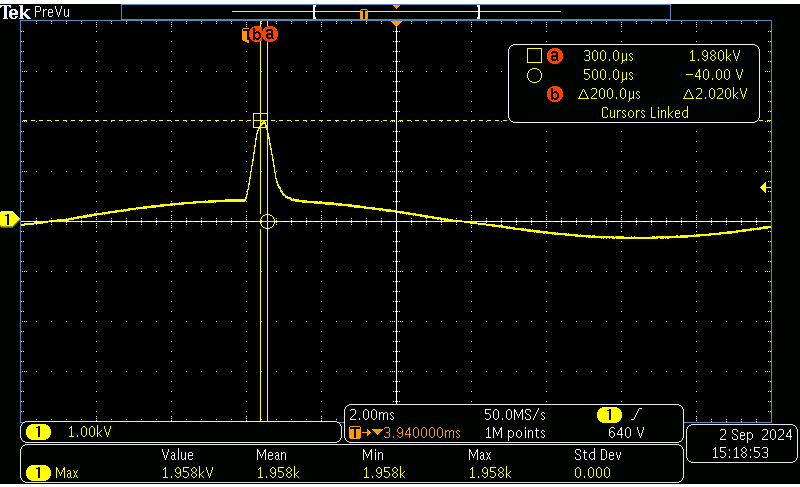
Most ITIC test conditions (i.e. the yellow and green zones on the curve) are easy to achieve with Chroma test equipment. The 500% voltage surge test in the red zone poses a more significant challenge. To help users accelerate product development and validation, we conducted simulations using 105kVA Chroma 61800-100 Grid Simulators. As shown in Figure 2 below, we achieved a peak voltage of 1.9kV 3 and maintained it for 200 microseconds. If you are looking to enhance the stability of your electronic products through ITIC Curve testing, visit the Chroma website to learn more about our grid simulation solutions.

▲Figure 2
For more information on the Chroma 61800-100 Grid Simulator, please visit the product page linked below. Leave your requirements and contact information, and we'll be happy to assist you.
| Chroma 61800-100 Grid Simulator |
[1] https://www.bloomberg.com/company/press/generative-ai-to-become-a-1-3-trillion-market-by2032-research-finds/
[2] https://voltage-disturbance.com/voltage-quality/itic-curve/; The ITIC Curve referenced is color-coded for clarity in this article.
[3] Peak voltage of 500% voltage = RMS value × 500% × 1.414. Based on an RMS value of 277Vac, the peak voltage is calculated as 277 × 5 × 1.414 = 1958Vpeak.